Each account starts here. Use the button below to enter the customer journey (generic or scan a customer QR for that account).
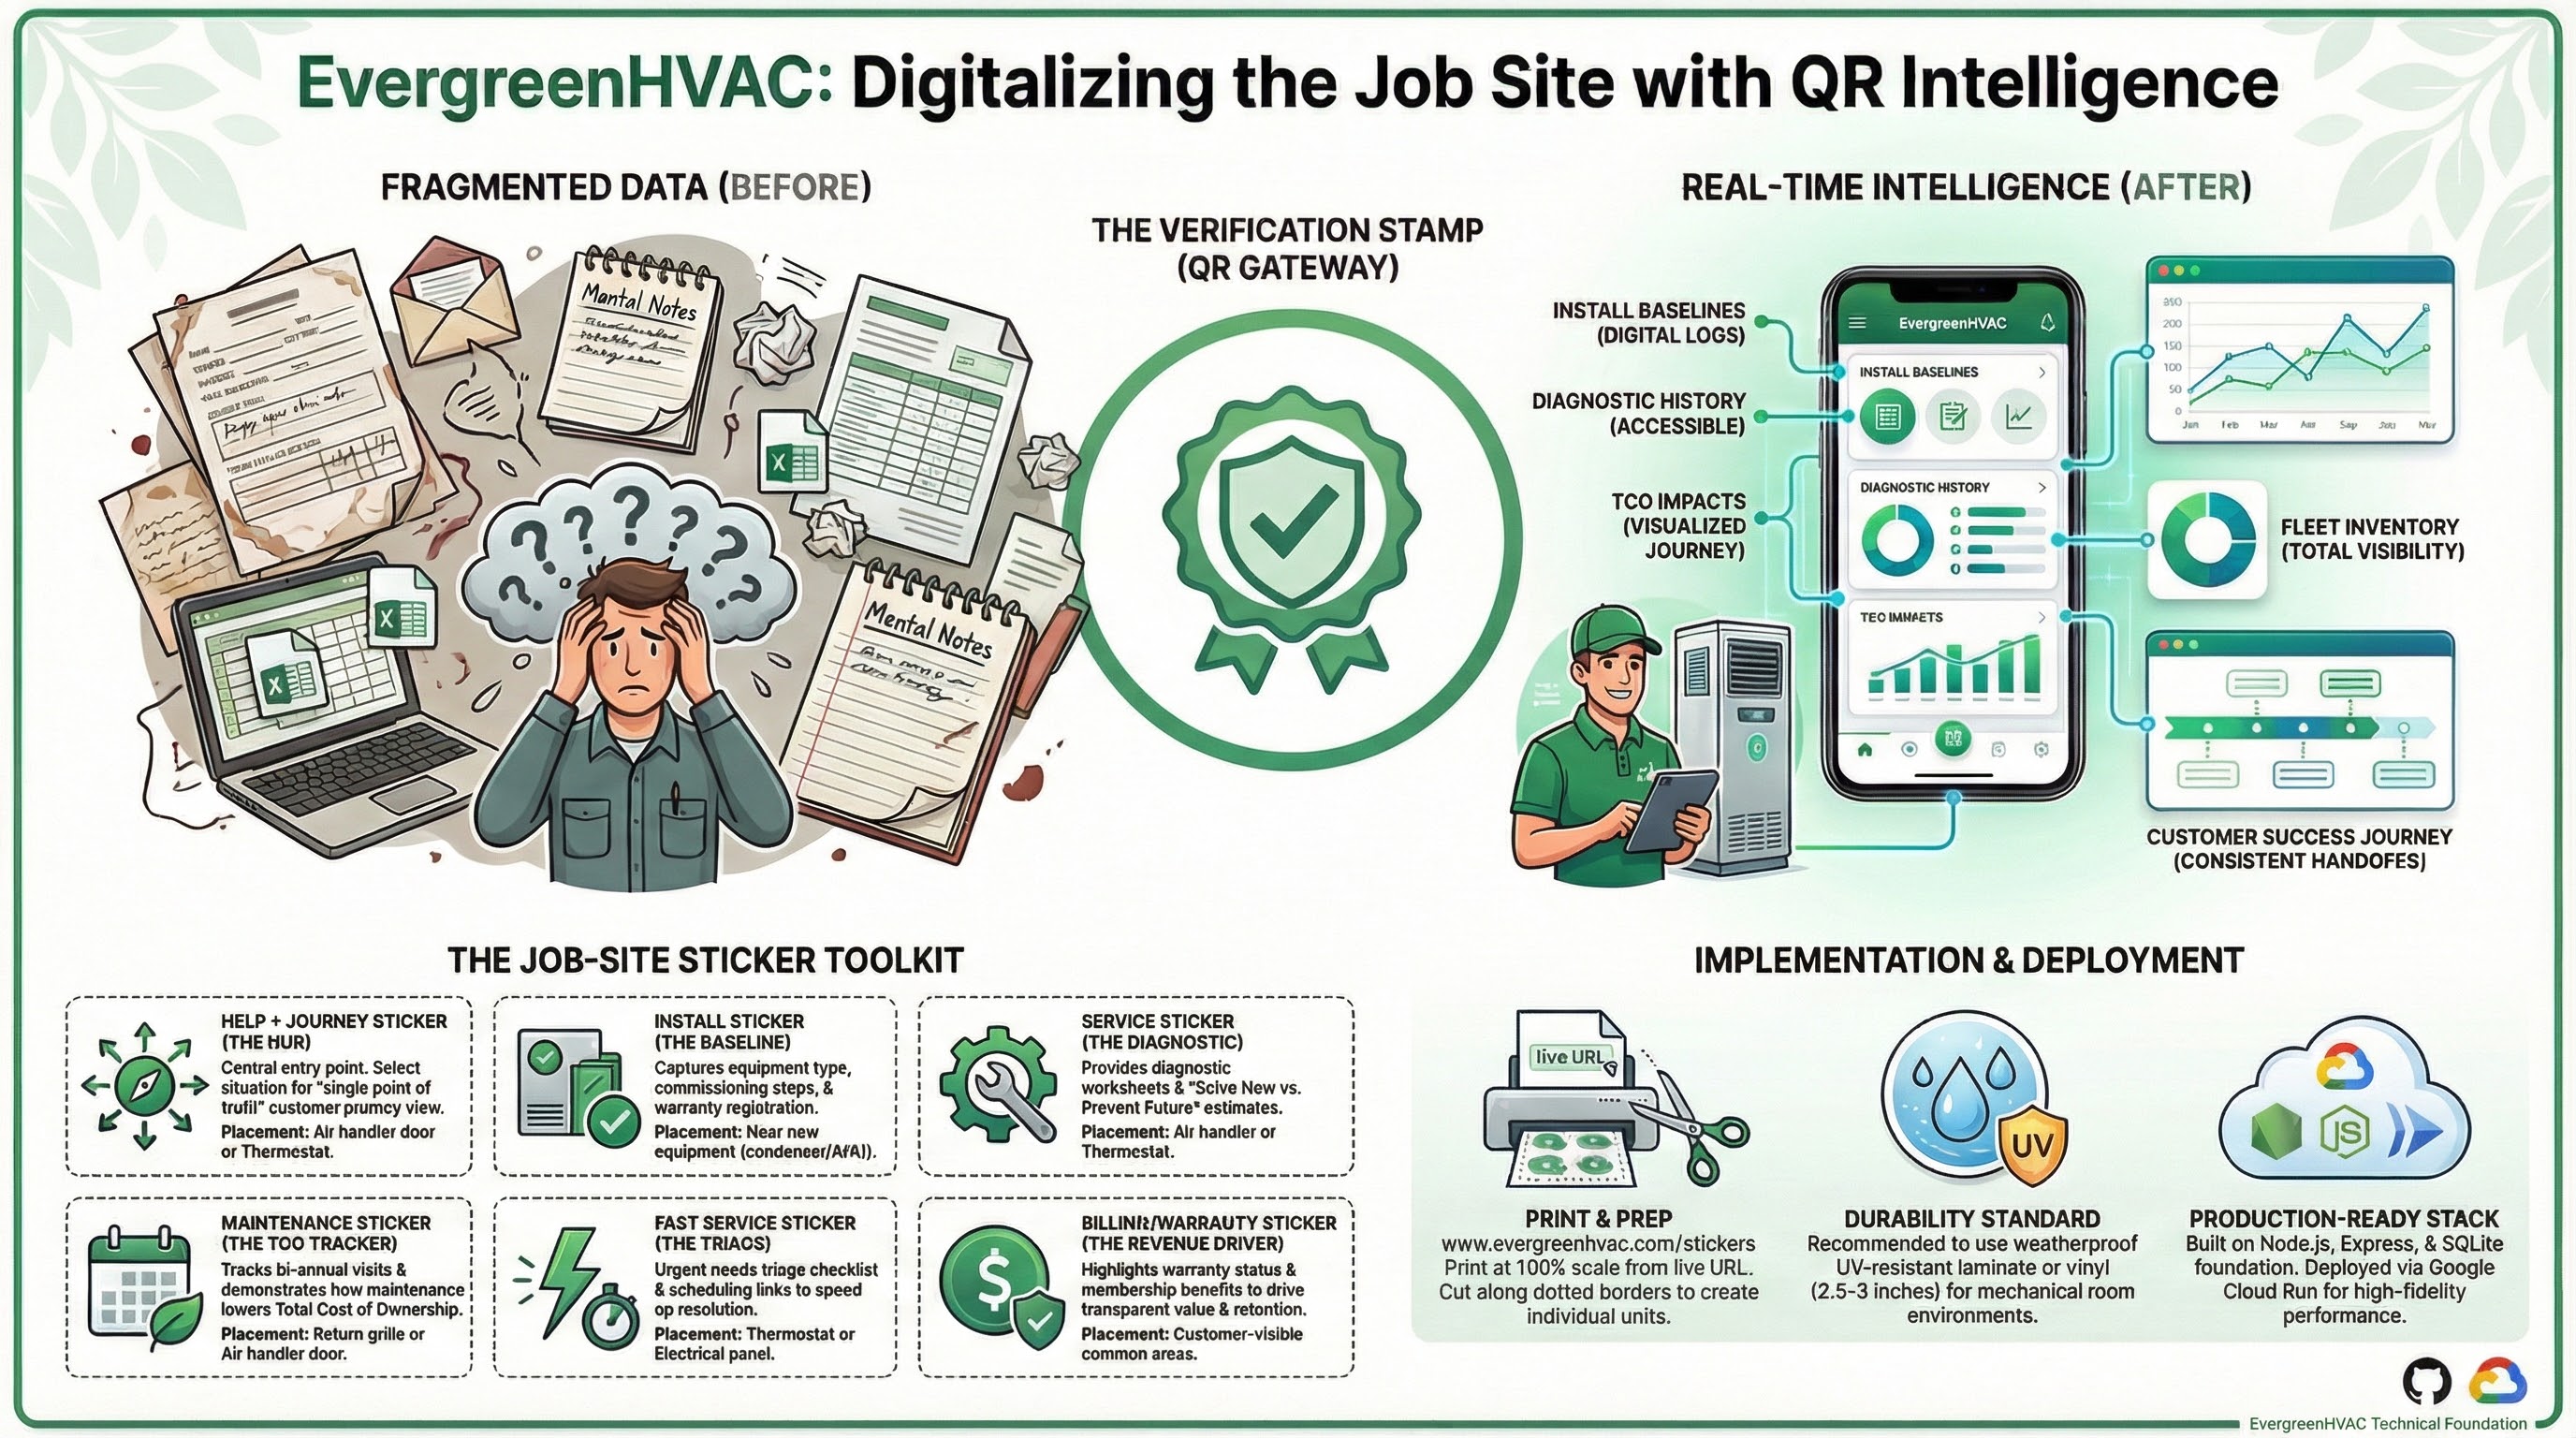
The problem
Field operations often run on fragmented data: paper logs in the truck, mental notes that never get recorded, and disconnected spreadsheets that don’t talk to each other. That leads to capacity blindness, inconsistent handoffs, and missed revenue and touchpoints for customer success.
The solution
The QR sticker acts as a “verification stamp” at the job site. Every scan gates access to the right journey data and turns the job site into a data capture point. One scan replaces hunting for paperwork or repeating the same story to the next tech.
The outcome
Real-time visibility: install baselines (digital logs), diagnostic history, TCO with and without maintenance, fleet and customer view, and consistent handoffs. Technicians and office staff see the same picture so follow-up and scheduling stay aligned.
Data cycle
How information flows from job site to database and back to the team:
flowchart LR
  subgraph site["Job site"]
    A[Tech scans QR] --> B[Device opens journey URL]
  end
  subgraph app["Job Site QR app"]
    B --> C[Express receives request]
    C --> D[Load customer and system]
    D --> E[SQLite: customers, systems, visits, lifecycle]
    E --> F[Render install baseline, history, TCO]
    F --> G[Tech views & logs visit / updates]
    G --> H[POST visit or PATCH slot]
    H --> E
  end
  subgraph visibility["Visibility"]
    E --> I[Office and next tech see same data]
    I --> J[Reports, scheduling, handoffs]
  end
Customer cycles
Stages of the customer journey and how they connect:
flowchart TB
  subgraph install_handoff["Install & handoff"]
    I1[Install] --> I2[Commission]
    I2 --> I3[Warranty / Billing]
  end
  subgraph success["Customer success"]
    M1[Maintain] --> M2[Weekly log]
    M2 --> M3[Service / open issues]
  end
  subgraph triage["Triage"]
    H[Help now]
  end
  I3 --> M1
  M3 --> H
  H --> M1
  I1 --> H
Lifecycle: Each customer has a maintenance schedule (spring/fall slots). Completing a visit links it to a slot; office and techs see the same diagram and next-due dates.
The toolkit
Each job-site sticker links to a specific part of the customer journey: Help + Journey (hub) at air handler door or thermostat; Install near new equipment (condenser/AHU); Service at air handler or thermostat; Maintenance at return grille or air handler door; Fast Service at thermostat or electrical panel; Weekly for open issues and next action; Billing/Warranty in customer-visible common areas. See the placement guide and product doc for how to cut and when to use each sticker.
Architecture
Technical stack and data flow end to end:
flowchart TB
  subgraph client["Client"]
    QR[QR sticker] --> Browser[Browser]
    Browser --> Static[Static HTML/CSS/JS]
  end
  subgraph server["Server (Node.js)"]
    Express[Express]
    Static --> Express
    Express --> API["/api/customers, lifecycle, reports, training, servicetitan"]
    Express --> Auth["/auth/login, register"]
    Express --> Pages["/journey, /c/:id/:page, /admin, /login"]
  end
  subgraph data["Data"]
    API --> SQLite[(SQLite)]
    SQLite --> Tables["customers, systems, lifecyclePlans, maintenanceVisits, weeklyLogs, openIssues, tcoData, integration_settings"]
  end
  subgraph integrations["Integrations"]
    API --> ST[ServiceTitan API]
    ST --> Sync["Sync / match customers, visit-complete hook"]
  end
  subgraph deploy["Deploy"]
    CloudRun[Google Cloud Run]
    Express --> CloudRun
  end
Single process: Express serves static files and API routes. SQLite holds all app data; optional ServiceTitan sync and lifecycle hooks keep CRM aligned.
Implementation
Print at 100% scale from the live URL (e.g. https://job-site-qr-262845224632.us-central1.run.app/stickers-print.html). Cut along the dotted borders to create individual stickers. Use weatherproof UV-resistant laminate (2.5–3 in) for mechanical room environments. The app is built on Node.js, Express, and SQLite and deployed on Google Cloud Run for a production-ready stack.